
As humans, we perceive sound in a very specific way in our hearing range (roughly 20Hz–20,000Hz). Devices, however, have the option to make register sound either very objectively, or rather subjectively—sometimes resulting in unwanted confusion or even intended deceit.
Gather. Transfer. Dissect.
..the verbs that describe the functions of our outer-, middle-, and inner ear respectively. The process of hearing sound is an interesting one. Sound goes through quite the ordeal before our brains register it (let alone process it and attach emotions to it). When a sound is produced, it is captured by our external ears (auricle or pinna) which are positioned on the sides of our heads—acting like satellite dishes (what a brilliant design!)—which focus sound towards the opening of our ear canal. This opening is referred to as the concha. Our ear canal (auditory canal) is essentially a little tube about an inch long with about a ¼” diameter (we’ll get back to the significance of this in a bit). On the very end of this canal sits our eardrum (the tympanic membrane), which most people will at least have heard of.
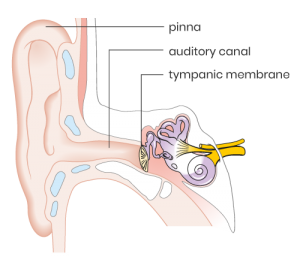
The eardrum vibrates analogous to the vibrations of the initial wavefront. Now, on the other side of the eardrum, there are the middle and inner ear, both serving very specific functions in converting sound waves to neurons discharging. For this post, our focus remains with the outer ear.
Not all frequencies are equal
All frequencies are, in fact, equal. Nature doesn’t discriminate against certain frequency ranges—or entire octaves for that matter. Our ears definitely do, however. They do so for good reasons. The auricle—the part of the ear you can grab—is mainly responsible for funneling sound towards the concha, and thus the ear canal. Additionally, the ridges on your ear (the antihelix specifically) help with adding localization information. Lastly, the concha resembles an actual funnel, which in turn results in amplification of sound.
The specific length and diameter of the ear canal and the transfer mechanism of the ossicles make it that the 2-5kHz range specifically is amplified, more so than other ranges. The most important parts of human speech lie in this range—the frequencies most responsible for intelligibility in speech. Coincidence? Absolutely not.
Equal-Loudness Contours
Or, lines plotted on a graph indicating “how loud do frequencies have to be, to be perceived equally as loud”. The research into the frequency-discriminating nature of our hearing was initially spearheaded by Harvey Fletcher and Wilden Munson in the early 30s of the last century. Researched was performed clinically to create the plot below; the blue lines are the results from Fletcher and Munson’s research:
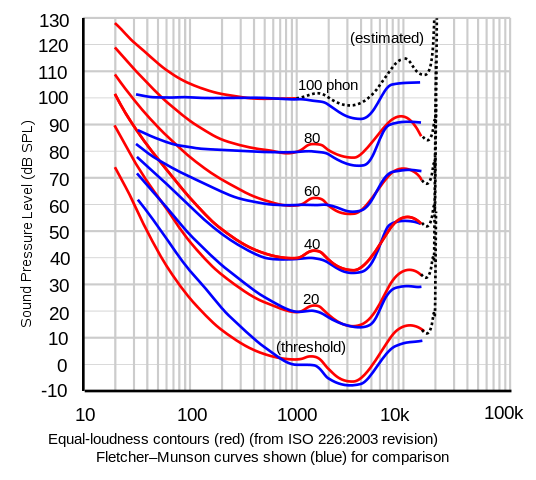
The conclusion of this research shows not only that our hearing is more sensitive to certain frequency ranges, but it also shows us the behavior of this is a function of amplitude. Let’s take a moment and dissect what is shown above while ignoring the red contours for now.
Different frequencies, similar perceived loudness
The blue contours—or curves—are referred to as phon curves. The phon is a unit of loudness for pure tones—or sine waves. Every single line in the graph has the same reference point in terms of frequency, the 1kHz pure tone. For instance, the 20-phon curve’s reference point is 1kHz, at and amplitude of 20dB SPL (Sound Pressure Level). In order to create the rest curve of the curve, we play two pure tones in succession to a test subject. One of these pure tones is always 1kHz—this being our reference point—and the other one is any other pure tone within our hearing range (20Hz–20kHz) we’re comparing to our reference point.
Let’s say we’re comparing 250Hz to 1kHz. According to the results above (again, blue curves), Fletcher and Munson concluded that on average 250Hz needs to be played at 35dB SPL in order for it to be experienced as equally as loud as 1kHz played at 20dB SPL. This is both interesting (to us at least 🤷) and significant. Note that our hearing experiences a 10dB SPL increase in amplitude as twice as loud. In other words, 250Hz was made more than twice as loud for people to agree that, yeah, now it’s about just as loud.
Research never stops
There were many iterations of this experiment, to probably test the validity of these results with newer (more accurate) technology. The culmination of these results was adopted in a new standard in equal loudness contours under ISO 226:2003, which curves are illustrated in red above. They generally follow the same shape of Fletcher & Munson’s results, aside from the lower 3 octaves (20Hz–160Hz); this is probably due to the improvement in audio playback in this range later in the 20th century.
To give another example using the red contours. Let’s look at the 60-phon curve, and specifically 20Hz and 3kHz. Logically, the 60-phon curve has 1kHz at 60dB SPL as its reference point. If we follow the curve to the left until we hit 20Hz, we’ll see that 20Hz needs to be played back at ~108dB SPL for people to experience it as equally as loud. That is absolutely nuts! (Remember that an increase of ~10db SPL is experienced by the average human as twice as loud.) Looking at 3kHz, people actually requested the pure tone to be turned down in volume a couple of dBs in other for them to say that it sounds equally as loud as 1kHz at 60dB SPL.
All contours in the graph clearly show that our ears are a lot more sensitive—even tuned in to—the speech range, which is roughly 2kHz–5kHz (2000Hz–5000Hz). Alternatively, a lot less significance is put on the lower 3 octaves (20Hz–160Hz) and the highest octave (10kHz–20kHz).
How SPL meters fit into this
Devices that can ‘hear’ are generally a lot more straightforward and objective. By and large, you don’t have to worry about the amplitude levels influencing the frequency response. In fact, devices that measure objectively how loud sound is (SPL meters, that is) usually have specific optional curves added that one can select when performing a measurement. Applying one of these curves—or better yet, contours—is called weighting the measurement.
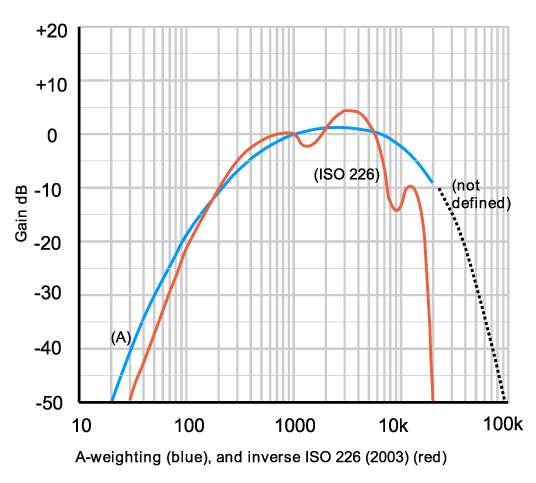
Typically, an SPL meter will usually have at least 3 weighting settings to choose from: A-weighted, C-weighted, and Linear (or Z-weighted, if more recent). When selecting the A-weighted setting, the inverse of the 40-phone contour will be applied to the frequency response of the measurement (see graph below). With C-weighted measurements, an inverse of the 80-phon contour will be applied. With Linear/Z-weighted, a flat frequency response will be applied. When measurements are performed with any of the weightings applied, the results will be denoted as dBA, dBC, or dBLin respectively.
Lastly, SPL meters usually have an option to switch between slow and fast. The purposes are to get an average amplitude level reading over a certain amount of time, or peak amplitude levels, respectively.
Noise ordinance levels
One of the more typical uses of sound measurements is to check noise ordinance levels. In other words: am I making too much noise according to the city/municipality I live/work in? Most cities will have their limits available on their website, and it’s usually a certain number in dB for residential settings, and for commercial settings, during specific timeframes (usually 7am–10pm, and 10pm–7am). To give a more concrete example, a direct quote from Austin, TX’s Noise Ordinance:
(3) DECIBEL means sound pressure level as measured by a sound level meter using the “A” weighting network and either the slow or fast meter response as specified by the American National Standards Institute.
§ 9-2-4 – RESTRICTION ON DECIBEL LEVEL.
A person may not operate sound equipment at a business that produces sound:
(1) in excess of 85 decibels between 10:00 a.m. and 2:00 a.m., as measured at the property line of the business; or
(2) is audible at the property line of the business between 2:00 a.m. and 10:00 a.m.
Source: 1992 Code Section 10-5-4; Ord. 031023-13; Ord. 031211-11.
The problem with the ordinance specifications
First, it states that any reference to the word decibel indicates an amplitude measurement in dBA. Point (1) mentions an amplitude level of 85 decibels. We know that our hearing responds differently to sounds at +80dB SPL amplitude levels compared to 40dB SPL (the reference amplitude level for dBA measurements). To better explain the discrepancy, let’s look at how we would experience 80Hz—not an uncommon frequency at all in live sound environments—following dBA measurements, and dBC measurements.
Mind that generally A-weighting is the default sound measurement weighting, regardless of amplitude level.
Following the 40-phon curve (A-weighted), it shows that 80Hz needs to be played back at an amplitude level 30dB SPL louder for people to agree it would be just as loud as 1kHz at 40 dB SPL. This is 8 times as loud. Compare this to the 80-phon curve (C-weighted); 80Hz needs to be played back at 95dB SPL—an increase of 15dB SPL, a little over twice as loud as the reference tone.
Let’s put that into perspective. Performing an A-weighted measurement for an amplitude level of 85dB SPL, will make the sound measurement device half as sensitive to frequencies below 100Hz. This would be in favor of the business that produces sound.
Conclusion
The fact that A-weighted measurements are the default sound measurement method introduces skewed data from the get-go. Sure, A- and C-weightings are based on Equal Loudness Contours, which in turn were created using only pure tones, not noise bands, which would more accurately resemble our general sound perception in the world. This fact does not take away the discrepancy between what is legally allowed—in terms of sound levels—and how loud we would actually perceive it.
Confused yet? Not our intention at all! Do reach out to us at Calico if you’re in need of objective sound measurements, or need help in making sense of noise ordinances.